In this digital age, understanding data is important for any business aiming to thrive online. Shopify analytics offers a comprehensive suite of tools that empower merchants to harness this data, diving deep into their store’s performance metrics, customer behavior, and marketing campaign outcomes.
In this article, we’ll look at Shopify analytics, types of Shopify reports and how to use the analytics to make strategic decisions.
What are Shopify Reports?
Shopify Reports serve as an essential, all-in-one tool for monitoring various aspects of performance for anyone managing a Shopify store. Their Reports dashboard is specialized for eCommerce, exceeding the capabilities of standard analytics software, providing critical insights into metrics such as conversion rates, average order sizes, and where your customers are coming from. The user-friendly interface simplifies complex data, making it accessible for both analytics novices and experts to obtain actionable insights.
These Reports don’t just scratch the surface; they enable a deep dive into your store’s operations. You can discover which products are your bestsellers, differentiate between new and returning customers, and identify the most lucrative times for sales. This level of detailed information is crucial for pinpointing any bottlenecks in the customer experience.
If you’re thinking about launching a Shopify store, having a firm grasp of how Shopify Reports function is vital. With this feature, you’re not merely setting up an online shop; you’re equipping yourself with a sophisticated analytics tool set that can help you better understand your customer behavior and optimize your store for success.
Understanding Shopify Analytics and Reports
At its core, Shopify Analytics and Reports aim to provide merchants with information about their store’s operations and customer behaviors, but to effectively leverage its potential, one needs to have a deeper understanding of its components and the story they tell. The following is the breakdown of these components:
1. Sessions and visitors
These metrics display the number of people visiting your store. While they might seem straightforward, it’s crucial to distinguish between total sessions and unique visitors. For instance, one visitor might account for multiple sessions if they visit the store several times.
2. Sales metrics
This includes total sales, average order value, and the sales by traffic source. Understanding these metrics can help determine the effectiveness of marketing campaigns and where most revenue originates.
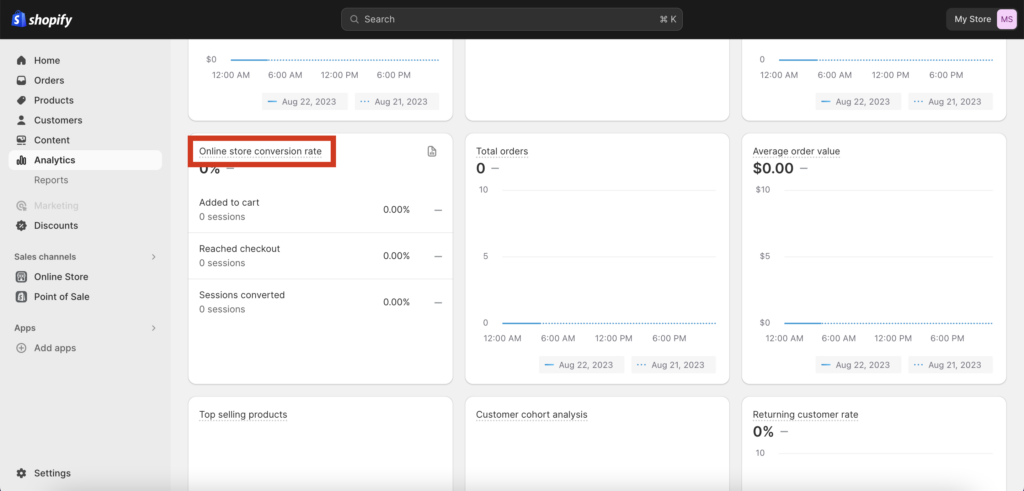
3. Conversion rate
This data point tells the percentage of visitors who make a purchase. If it’s low despite high traffic, it may indicate issues with product listings, pricing, or the checkout process.
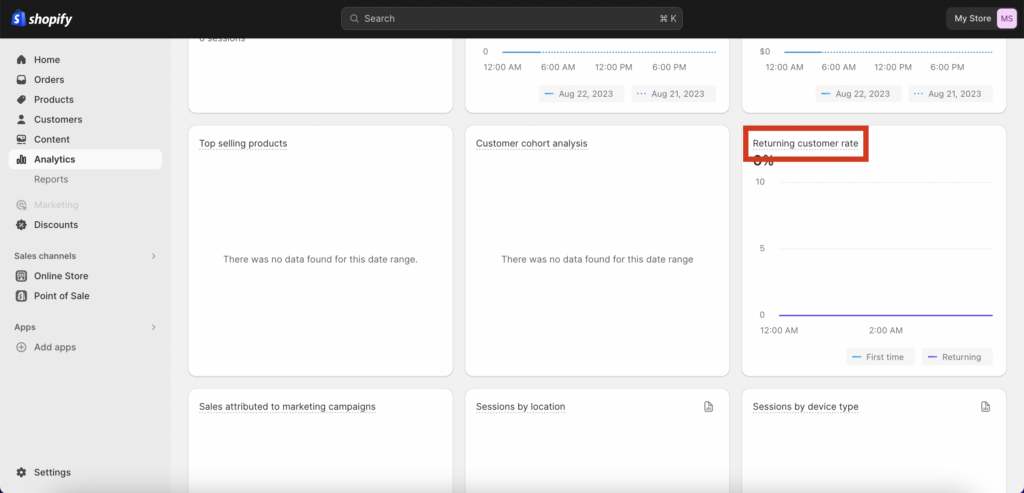
4. Customer metrics
These metrics encompass data like returning customer rate. A high returning customer rate indicates customer satisfaction and loyalty.
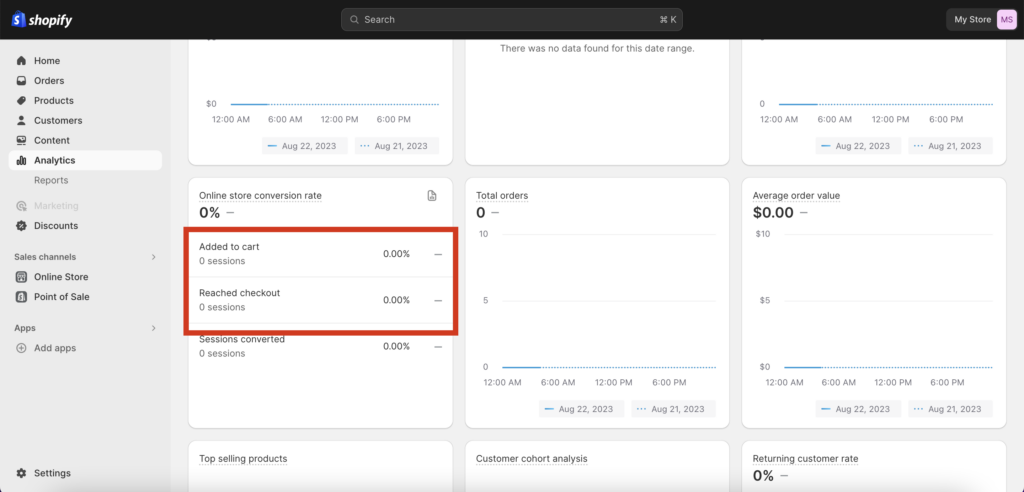
5. Online store behavior
Here, you can understand the customer journey. Metrics like ‘added to cart’, ‘reached checkout’, and ‘purchased’ can help in identifying bottlenecks where customers drop off.
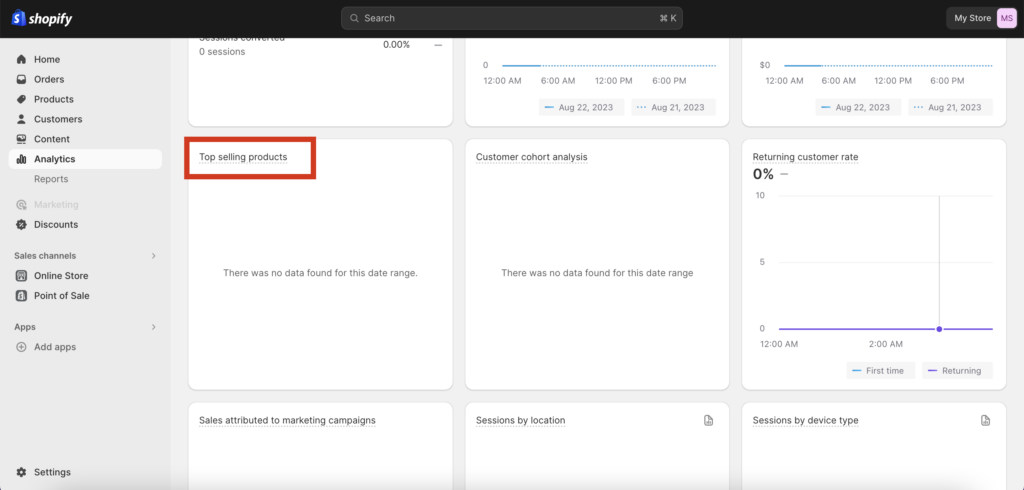
6. Top selling products
This metric allows merchants to recognize their best-performing products.
7. Traffic sources
This data divides the incoming traffic based on the source – direct, social, email, or organic search. It helps businesses understand where their marketing efforts are paying off.
To fully harness the power of Shopify Analytics, retailers must be proactive. Merely looking at the numbers isn’t enough; one needs to analyze patterns, recognize anomalies, and use this data to strategize. For example, if a high percentage of visitors abandon at the checkout stage, it might be worth investigating if there are any technical issues or if the checkout process is too complicated.
MORE: What is Shopify Plus?
Types of Shopify Reports
Shopify reports are designed to provide merchants with a comprehensive view of their store’s performance. Here’s a deeper dive into the various types of reports it offers:
1. Sales Reports:
- Scope: These reports allow retailers to monitor sales patterns over different time frames.
- Benefits: You can gauge your store’s performance during specific hours, days, months, or even annually. It’s especially useful during promotional periods, helping businesses adjust their strategies accordingly.
| Key Metrics | Metric Description |
|---|---|
| Sales over Time | Indicates the number of orders and total sales over a chosen period. Takes both sales and returns into account. |
| Sales by Product | Breaks down sales by individual products, not including shipping costs. |
| Sales by Product Variant SKU | Provides sales data for each product variant, without accounting for shipping costs. |
| Sales by Product Vendor | Offers a breakdown of sales based on each vendor you work with. |
| Sales by Discount | Categorizes sales based on the name of discounts applied during purchase. |
| Sales by Traffic Referrer | Identifies the origin of sales, like specific web-pages, online ads, or search engine queries. |
| Sales by Billing Location | Organizes sales data by the geographical location of the billing address. |
| Sales by Checkout Currency | Enumerates sales based on the currency used at checkout, beneficial for international sellers. |
| Sales by Channel | Sorts sales by the platforms they came from, such as Facebook, Point-of-Sale (POS), or your Shopify Online Store. |
| Sales by Customer Name | Shows sales data grouped by individual customers over a selected time period. |
| Average Order Value over Time | Tracks how the average value of orders has evolved over a specified timeframe. |
MORE: How much does Shopify cost?
2. Customers Reports:
- Scope: Dive into the demographics and behavior of your customer base.
- Benefits: Unearth insights about your customers’ geographic locations, spending patterns, and loyalty. Knowing if they’re repeat buyers or first-time visitors can influence marketing and sales strategies.
| Key Metrics | Metric Description |
|---|---|
| Customers over Time | Displays the number of customers who have placed orders within a specific time range. |
| First-Time vs Returning Customer Sales | Compares the sales value between new and returning customers. |
| Customers by Location | Shows data related to orders and spend based on the customer’s geographic location. |
| Returning Customers | Provides details on customers who have made two or more orders. |
| One-Time Customers | Reveals data about customers who have made only one purchase. |
| At-Risk Customers | Shows data on returning customers who haven’t made a new purchase in a while. |
| Loyal Customers | Contains data on customers who frequently make purchases from your store. |
3. Behavior Reports:
- Scope: A window into how visitors engage with your online storefront.
- Benefits: Determine which pages of your store are the most visited, how much time customers are spending browsing, and identify potential roadblocks where they may be abandoning their journey, such as during the checkout process.
| Key Metrics | Metric Description |
|---|---|
| Online Store Conversion Over Time | Indicates the percentage of online store visitors who have made a purchase within a specified time period. |
| Online Store Speed | Compares your store’s speed against industry benchmarks and other Shopify stores. |
| Product Recommendation Conversions Over Time | Measures the effectiveness of converting product recommendations into sales. |
| Top Online Store Searches | Reveals the search terms customers are using most often in your online store. Includes a separate report for searches yielding no results. |
| Sessions by Landing Page | Identifies which pages visitors are landing on when they first arrive at your online store. |
| Sessions by Device | Shows which types of devices are most commonly used to access your online store. |
| Online Store Cart Analysis | Identifies products that are frequently added together to the cart, providing insights for potential product bundles and upselling. |
4. Marketing Reports:
- Scope: Measure the effectiveness of your marketing campaigns.
- Benefits: Track the influx of visitors and sales conversions resulting from specific marketing campaigns. This helps in allocating resources to channels that offer the best return on investment.
| Key Metrics | Metric Description |
|---|---|
| Sales Attributed to Marketing | Reveals the number of sales generated from specific marketing campaigns or channels. |
| Sessions Attributed to Marketing | Indicates the volume of web traffic coming from individual marketing initiatives. |
| Conversion by First Interaction | Shows order counts and average order values from first-time visitors, helping you understand which marketing channels are most effective for customer acquisition. |
| Conversion by Last Interaction | Highlights the number of orders placed by customers who haven’t returned to your site since their last purchase. |
| Attribution Model Comparison | Compares data between first and last interactions to help you understand customer retention and potential drop-off points. |
5. Acquisition Reports:
- Scope: Find out how you are acquiring new customers and from which channels they are coming.
- Benefits: Understanding your customer acquisition channels allows you to invest wisely in advertising. You can find out which sources—like social media, organic search, or direct traffic—are most effective for gaining new customers.
| Key Metrics | Metric Description |
|---|---|
| Sessions over Time | Measures the count of visitors within a specified time frame. |
| Sessions by Referrer | Reveals the origin of your web traffic by enumerating visitors and sessions that are referred from various sources like social media ads or affiliate links. |
| Sessions by Location | Specifies the geographic regions and countries from which users are accessing your website. |
6. Inventory Reports:
- Scope: These reports provide information about stock levels, sales rates, and product availability.
- Benefits: Inventory reports help in avoiding overstock situations, thereby optimizing your inventory costs and improving customer satisfaction.
| Key Metrics | Metric Description |
|---|---|
| Month-End Inventory Snapshot | Provides a tally of remaining stock for each product variant at the end of each month. |
| Average Inventory Sold Per Day | Reveals the average daily sales for each product variant, aiding in restocking decisions. |
| Percent of Inventory Sold | Displays the percentage of each product variant sold during a user-defined period. |
| ABC Analysis by Product | Assigns a letter grade to each product variant based on its contribution to overall sales. |
| Product Sell-Through Rate | Shows the percentage of total inventory sold during a selected timeframe. |
| Days of Inventory Remaining | Estimates the lifespan of your current inventory based on historical sales data for available products. |
7. Order Reports:
- Scope: Check details related to orders placed on your site.
- Benefits: These reports track order statuses, abandoned carts, and completed purchases to pinpoint areas for improvement in the ordering process.
| Key Metrics | Metric Description |
|---|---|
| Orders Over Time | Tracks the number of orders delivered during a specified period, offering insights into sales trends. |
| Fulfillment, Shipping, and Delivery Times | Measures the time from the moment an order is placed to its final delivery, helping you assess the efficiency of your fulfillment process. |
| Fulfillment Over Time | Reveals the total count of orders that have been fulfilled, shipped, or delivered during a chosen timeframe, which can help in workload planning and operational improvements. |
8. Profit Reports:
- Scope: A comprehensive look at your profitability, including revenue, costs, and margins.
- Benefits: Profit reports are vital for business sustainability, helping you identify which products are most profitable and which may be draining resources.
| Key Metrics | Metric Description |
|---|---|
| Profit by Product | Displays the total profit earned from each product over a specified time period. |
| Profit by Product Variant SKU | Provides a breakdown of profits for individual product variants during a chosen timeframe. Helps customization of inventory and promotional strategies for specific versions. |
| Profit by Point of Sale Location | Reveals gross profits by each point-of-sale location. |
9. Retail Sales Reports:
- Scope: These are specialized reports geared toward brick-and-mortar retail sales.
- Benefits: Gain insights into in-store behavior, peak shopping times, and popular in-store products, aiding in staff allocation and inventory planning.
| Key Metrics | Metric Description |
|---|---|
| Retail Sales by Product | Provides a breakdown of total sales by product, excluding shipping costs. |
| Retail Sales by Product Variant SKU | Offers a detailed breakdown of sales by each product variant, without including shipping costs. Helps in pinpointing which variants are more popular. |
| Retail Sales by Product Vendor | Compares sales data by vendor, showcasing how each vendor’s products perform. Grouped by Point of Sale (POS) location, it’s useful for supply chain decisions. |
| Retail Sales by Product Type | Highlights sales of specific types of products, organized by POS location. |
| Retail Sales by Point of Sale Location | Reveals total sales from each retail location, helping you identify the best and worst-performing outlets. |
| Retail Sales by Staff at Register | Displays sales made by each staff member at the register. |
| Retail Sales by Staff Who Helped with Sale | Highlights sales attributed to staff who assisted in line-item sales at checkout. Key for monitoring employee performance and incentives. |
10. Custom Reports:
- Scope: Custom reports allow you to build specialized reports based on unique business needs.
- Benefits: You can tailor your data analysis to focus on specific metrics or time frames that are particularly important for your business strategies.
11. Shopify Reporting Apps:
- Scope: These are third-party applications designed to enhance Shopify’s default reporting capabilities.
- Benefits: These apps can offer more advanced analytics, automated report generation, and specialized data visualizations to provide deeper insights into your business performance.
Each report category serves a unique purpose, offering merchants the tools to make informed, data-driven decisions to refine their business model, enhance customer experience, and ultimately, drive higher sales and profitability.
MORE: Shopify vs Shopify Plus
How to Use Shopify Reports
Whether you’re looking to gauge sales trends, track customer behaviors, or measure the success of marketing campaigns, Shopify’s built-in analytics has got you covered.
Accessing Shopify Analytics:
Step 1: Log In
Start by logging into your Shopify admin portal using your credentials.
Step 2: Navigate to analytics
Once inside, look to the left-hand sidebar and find the option labeled “Analytics.” This section serves as the hub for all the data-related insights your store has accumulated.
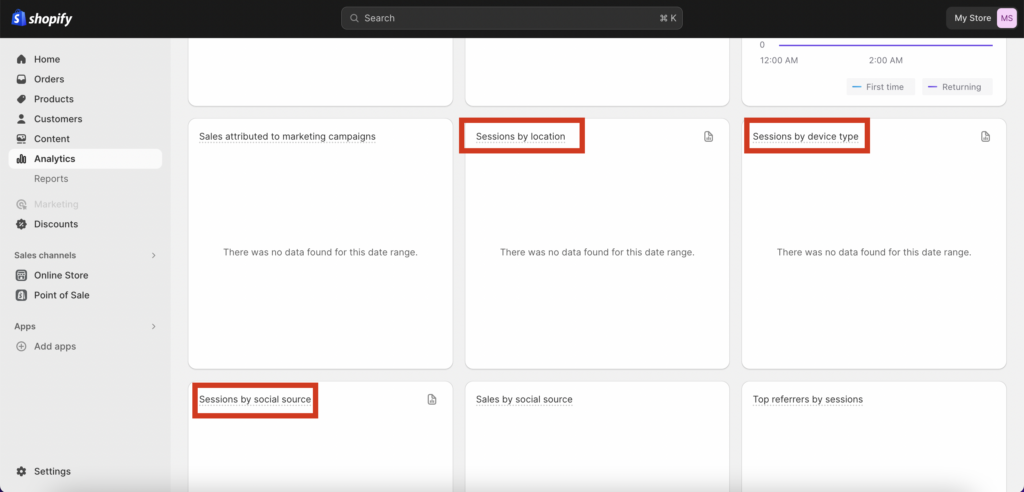
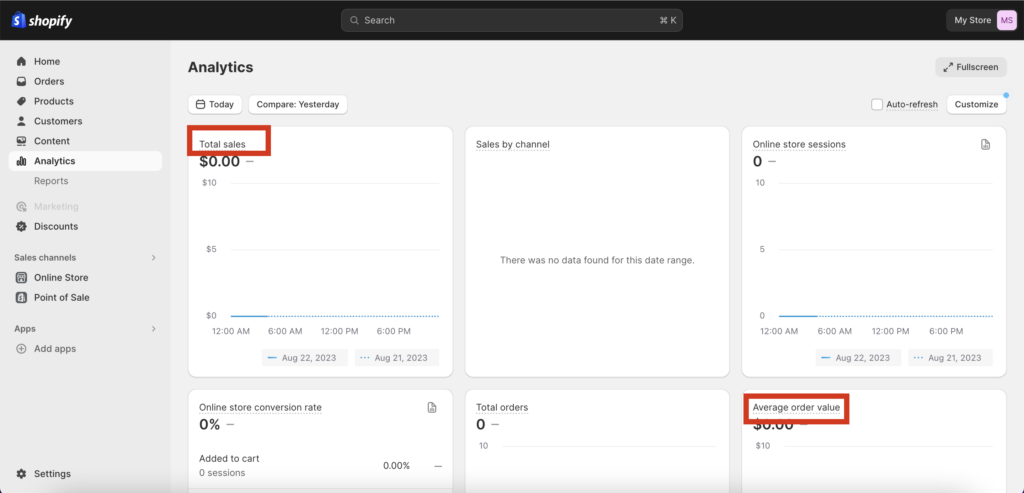
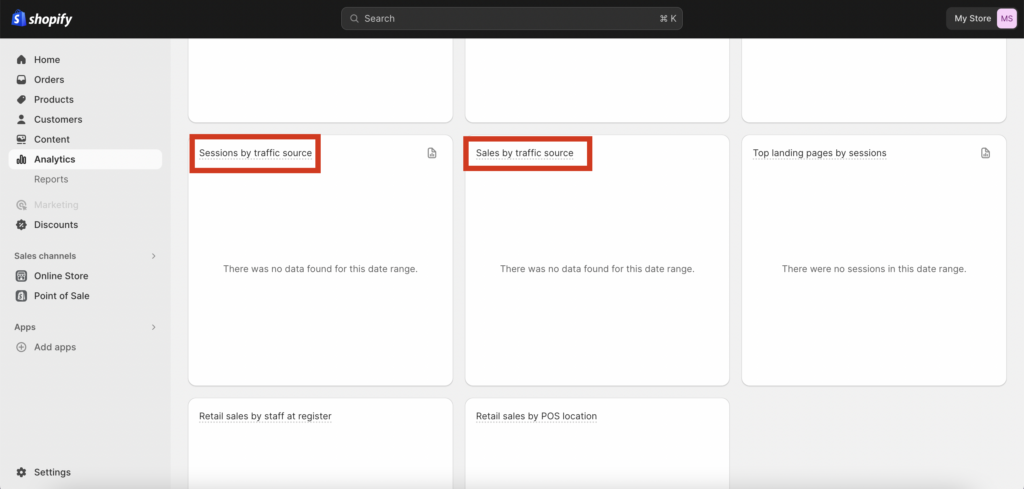
Step 3: Explore the dashboard
After clicking on “Analytics,” you’ll land on the ‘Dashboard’. This area provides a snapshot of your store’s current and recent performance, presenting key metrics such as total sales, visitor counts, conversion rates, and more at a glance.
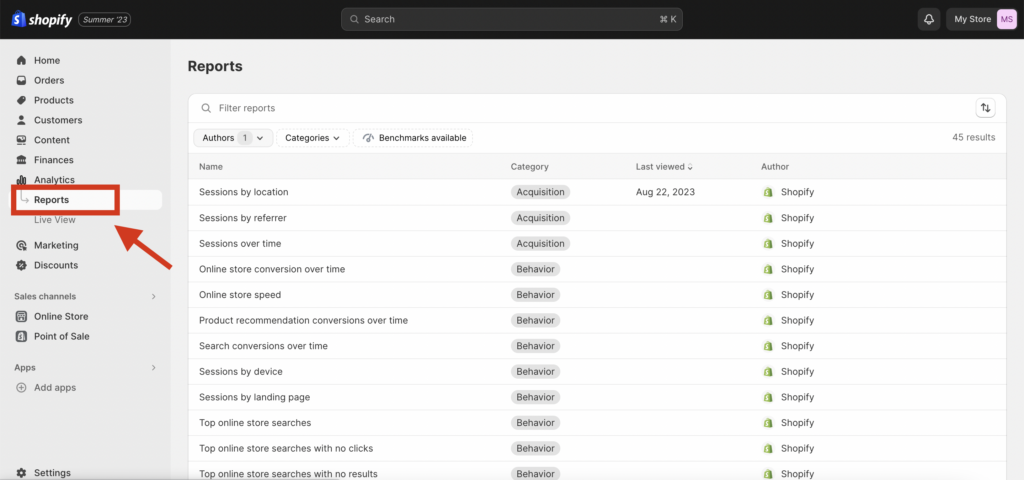
Step 4: Dive into reports
If you wish to dive deeper into specific areas of your store’s performance, click on the ‘Reports’ option. This will take you to a comprehensive list of available reports. Here, you can explore everything from detailed sales data segmented by product or time period, to customer acquisition sources, behaviors, and more. Each report can be customized based on the date range or other specific criteria you wish to analyze.
How to Analyze Shopify Reports
When analyzing data, make sure to consider the following:
Trends Over Time
- When you observe your data over extended periods, certain patterns or trends often emerge. For instance, do you notice an increase in sales during weekends or a particular time of the day? Maybe there’s a recurring dip in activity during a particular month or season.
- Identifying these patterns is crucial. If you’re witnessing spikes on specific days, you might consider intensifying your marketing efforts during these times. Conversely, during slow periods, you might launch special promotions to boost sales.
Top Products
- Keeping track of your best sellers is essential for multiple reasons. Not only does it give you insights into what’s popular among your clientele, but it can also influence your inventory decisions.
- By identifying which products are flying off the shelves, you can ensure that proper stock levels are maintained for them. Furthermore, understanding the popularity of certain products can guide product development and promotional strategies.
Customer Behavior
- Analyzing the behavior of visitors on your site can offer a wealth of information. For instance, you can find out how often customers return to make additional purchases.
- High exit rates on specific pages can be concerning. Is there something off-putting or confusing on these pages? It’s essential to address any underlying issues, enhancing the user experience and, by extension, boosting conversion rates.
Traffic Sources
- By understanding where your traffic originates, you can gauge the effectiveness of your various marketing strategies. Are your social media campaigns drawing in a significant number of visitors? Or is organic search your primary traffic driver?
- Recognizing the most effective sources of traffic allows you to allocate your marketing budget more wisely. For example, if you notice that paid advertising is bringing in a substantial portion of your visitors, you might consider increasing your ad spend in this area.
Takeaway Points
Shopify Reports and Analytics is a valuable tool that offers insights into your store’s performance. Regularly checking and understanding your analytics can guide business decisions, from branding and marketing strategies to product stocking. While Shopify Analytics is comprehensive, combining it with other tools like Google Analytics can provide even deeper insights into customer behavior.
Remember that by analyzing your store’s performance regularly, you’ll be on your way to making great progress and achieving success in business. And if you are just starting out on your Shopify store journey, or looking to refresh your Shopify store name, then use our Shopify store name generator to select a memorable store name in seconds.